A method for analyzing physiological data with multiple non-independent observations
DOI:
https://doi.org/10.31349/RevMexFis.72.051102Keywords:
Analysis, data science, electrophysiology, physiologyAbstract
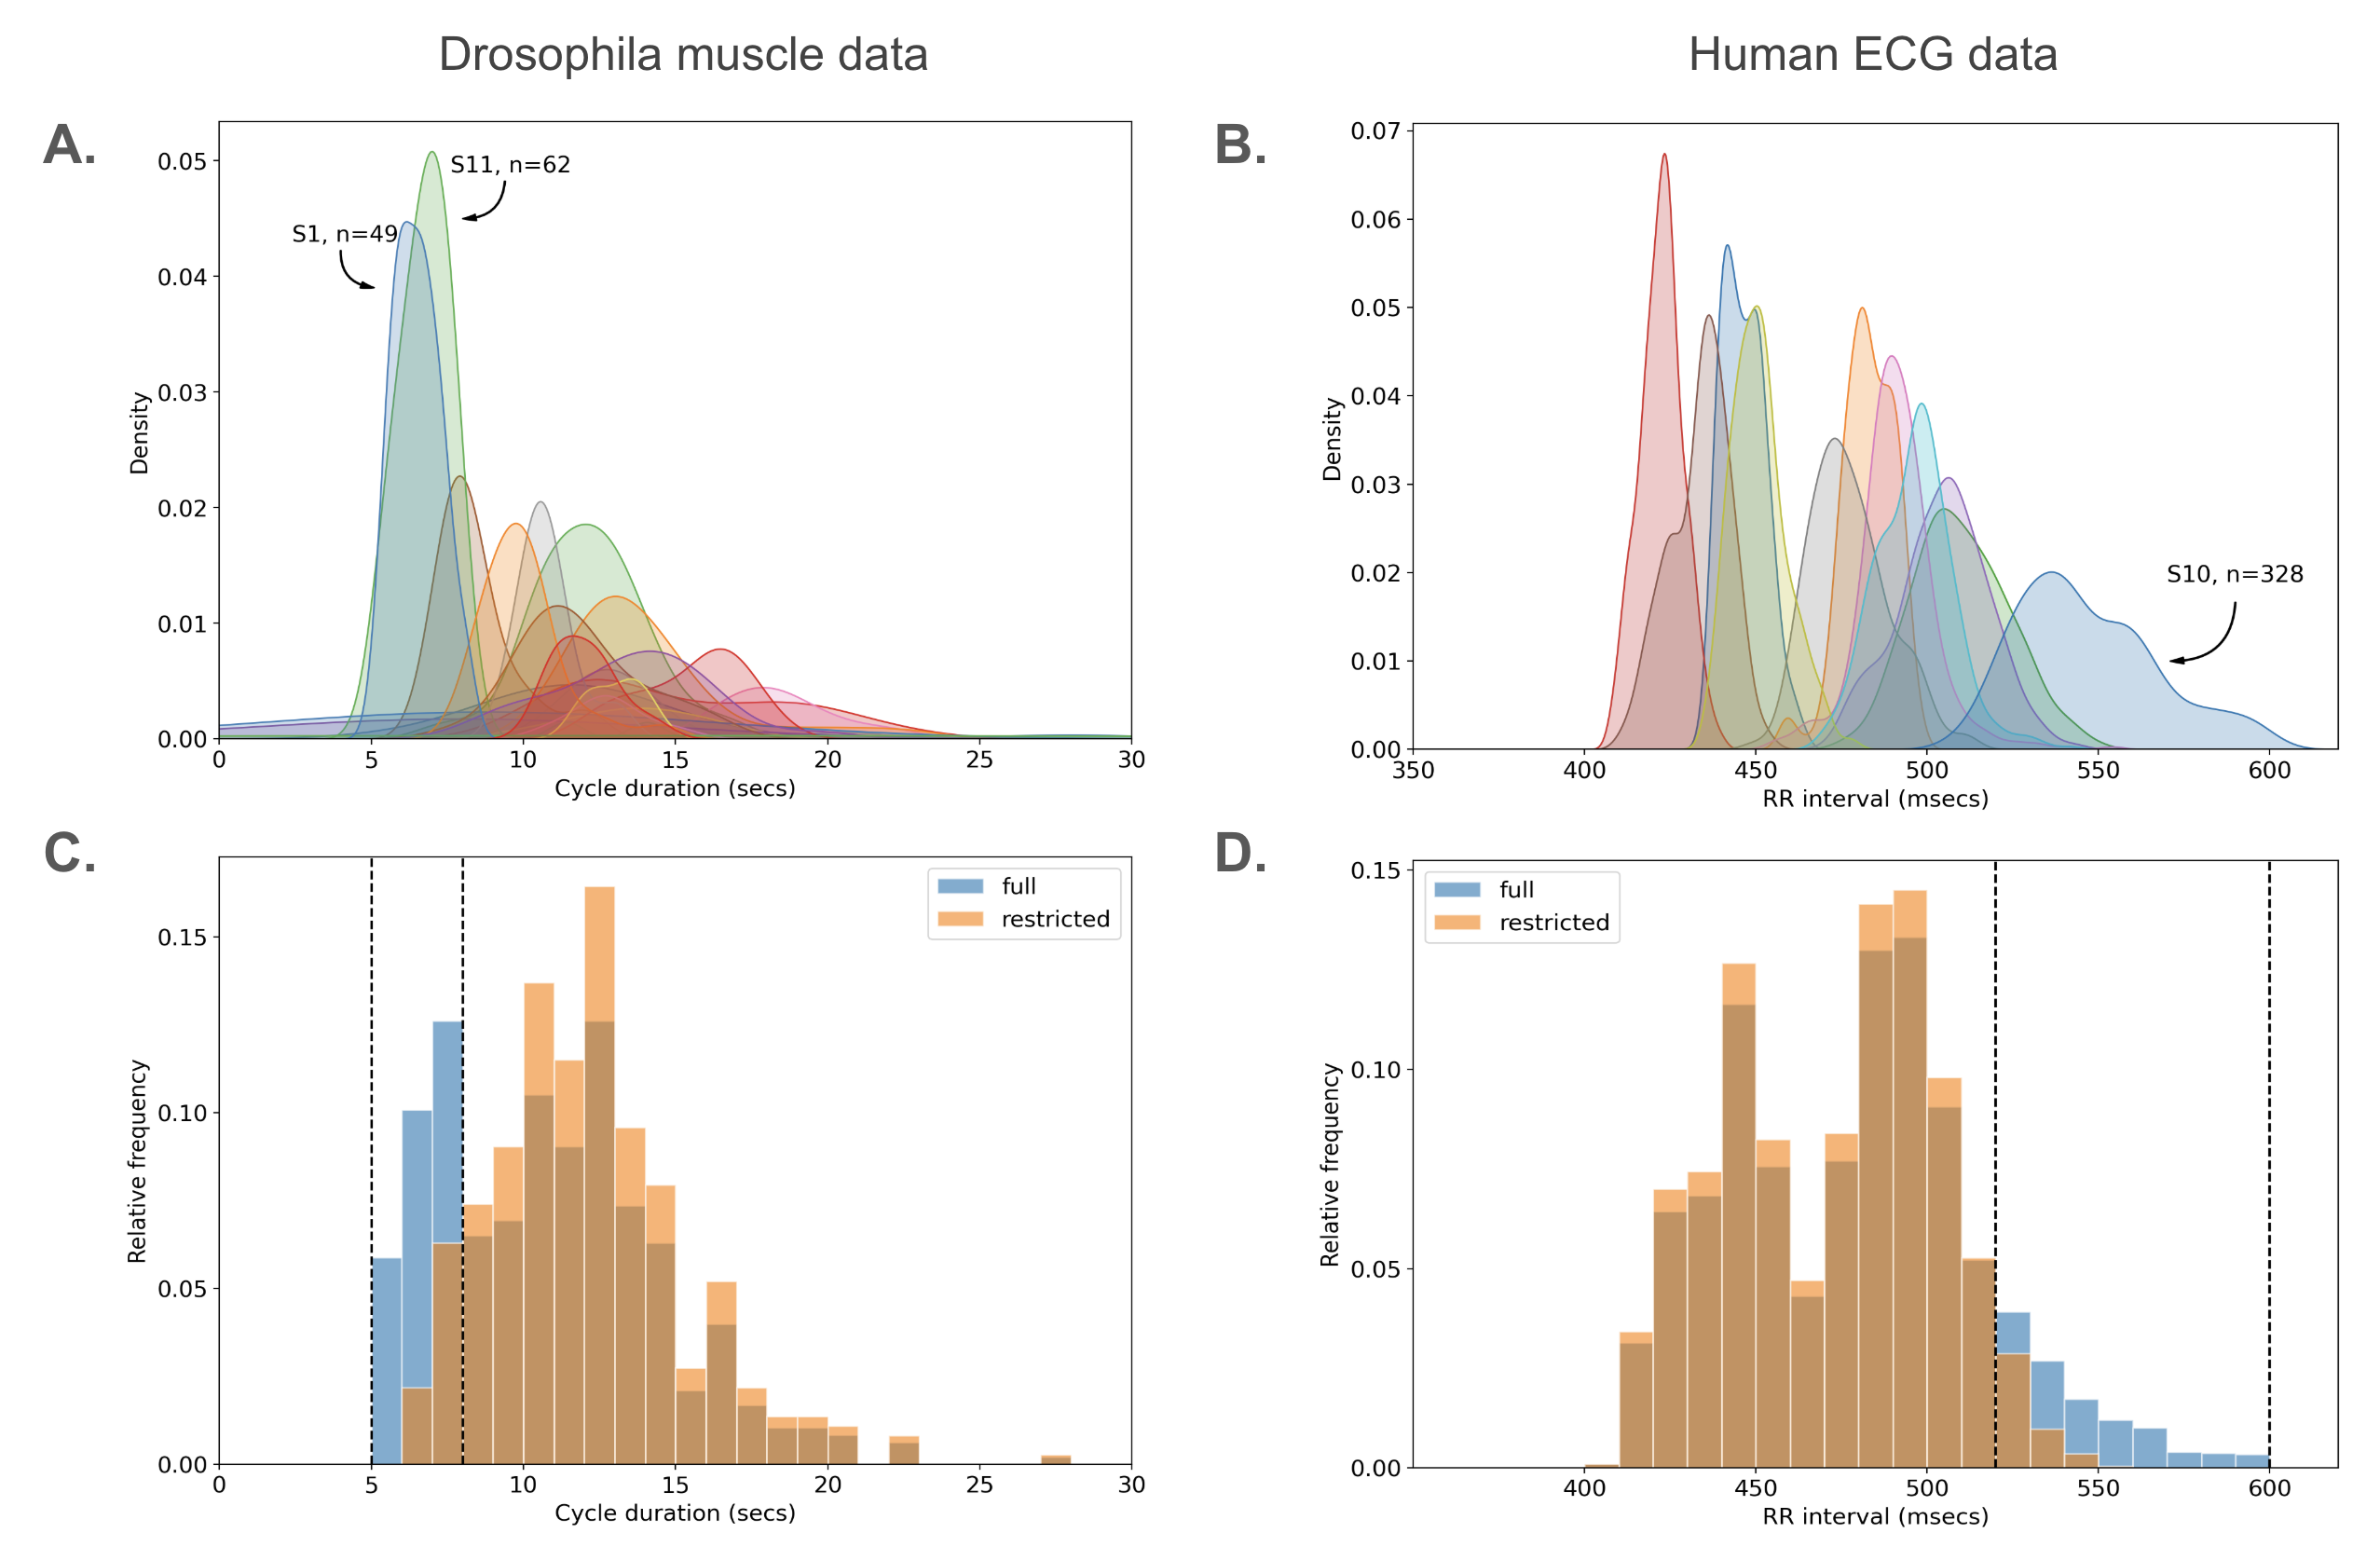
Physiological studies often involve recording multiple observations (e.g., repeated muscle contractions or cardiac cycles) from the same subject. To compare groups of subjects, observations from one subject are then sometimes pooled with observations from other subjects in the same group, and analyses are performed on these pooled data. This approach presents a number of potential problems, including over- or under-representing certain subjects in the sample and non-independence of measurements. There are statistical methods available to deal with repeated measures, but many make assumptions about the distribution and completeness of data. Instead, we developed a method to deal with multiple observations from physiological data that ensures that each subject is represented only once in the analysis (i.e. it avoids pseudoreplication), and makes no assumptions about the distribution of the data. We demonstrate this method using two different physiological datasets: (1) muscle recordings taken from Drosophila melanogaster larvae during fictive crawling, and (2) electrocardiogram recordings taken from human volunteers before, during, and after exercise. Our results show the broad applicability and validity of this method.
Downloads
References
L. Fox, D. Soll, and C.-F. Wu, Coordination and modulation of locomotion pattern generators in Drosophila larvae: effects of altered biogenic amine levels by the tyramine β hydroxlyase mutation, Journal of Neuroscience 26 (2006) 1486 DOI: https://doi.org/10.1523/JNEUROSCI.4749-05.2006
E. McKiernan, Effects of manipulating slowpoke calciumdependent potassium channel expression on rhythmic locomotor activity in Drosophila larvae, PeerJ 1 (2013) e57 DOI: https://doi.org/10.7717/peerj.57
K. Trimmel, J. Sacha, and H. Huikuri, eds., Heart rate variability: Clinical applications and interaction between HRV and heart rate (Frontiers in Physiology, 2015), https://doi.org/10.3389/978-2-88919-652-4 DOI: https://doi.org/10.3389/978-2-88919-652-4
S. Hurlbert, Pseudoreplication and the design of ecological field experiments, Ecological Monographs 54 (1984) 187 DOI: https://doi.org/10.2307/1942661
J. Schank and T. Koehnle, Pseudoreplication is a pseudoproblem, Journal of Comparative Psychology 123 (2009) 421 DOI: https://doi.org/10.1037/a0013579
S. Lazic, The problem of pseudoreplication in neuroscientific studies: is it affecting your analysis?, BMC Neuroscience 11 (2010) 1 DOI: https://doi.org/10.1186/1471-2202-11-5
D. A. Eisner, Pseudoreplication in physiology: More means less. Journal of General Physiology 153 no. 2 (2021) e202012826 DOI: https://doi.org/10.1085/jgp.202012826
T. Pollet et al., Taking the aggravation out of data aggregation: A conceptual guide to dealing with statistical issues related to the pooling of individual-level observational data, American Journal of Primatology 77 (2015) 727 DOI: https://doi.org/10.1002/ajp.22405
L. Muhammad, Guidelines for repeated measures statistical analysis approaches with basic science research considerations, Journal of Clinical Investigation 133 (2023) e171058 DOI: https://doi.org/10.1172/JCI171058
B. Hoang and A. Chiba, Single-cell analysis of Drosophila larval neuromuscular synapses, Developmental Biology 229 (2001) 55 DOI: https://doi.org/10.1006/dbio.2000.9983
P. Hoel, S. Port, and C. Stone, Introduction to Statistical Theory (Houghton Mifflin, 1971)
K. Ramachandran and C. Tsokos, Statistical estimation, In Mathematical Statistics with Applications in R, pp. 179-251 (Academic Press, 2021), https://doi.org/10.1016/B978-0-12-817815-7.00005-1 DOI: https://doi.org/10.1016/B978-0-12-817815-7.00005-1
P. Hoel, S. Port, and C. Stone, Introduction to Probability Theory (Houghton Mifflin, 1971)
A. Hart, Mann-Whitney test is not just a test of medians: Differences in spread can be important, British Medical Journal 323 (2001) 391 DOI: https://doi.org/10.1136/bmj.323.7309.391
P. McKight and J. Najab, Kruskal-Wallis test, The Corsini Encyclopedia of Psychology (2010) 1 DOI: https://doi.org/10.1002/9780470479216.corpsy0491
C. Harris et al., Array programming with NumPy, Nature 585 (2020) 357 DOI: https://doi.org/10.1038/s41586-020-2649-2
P. Virtanen et al., SciPy 1.0: Fundamental Algorithms for Scientific Computing in Python, Nature Methods 17 (2020) 261
J. Hunter, Matplotlib: A 2D graphics environment, Computing in Science & Engineering 9 (2007) 90 DOI: https://doi.org/10.1109/MCSE.2007.55
M. Waskom, seaborn: statistical data visualization, Journal of Open Source Software 6 (2021) 3021 DOI: https://doi.org/10.21105/joss.03021
T. Kluyver et al., Jupyter Notebooks-a publishing format for reproducible computational workflows, In F. Loizides and B. Schmidt, eds., Positioning and Power in Academic Publishing: Players, Agents and Agendas (2016) pp. 87-90, https://doi.org/10.3233/978-1-61499-649-1-87 DOI: https://doi.org/10.3233/978-1-61499-649-1-87
M. Waskom, seaborn Tutorial: Visualizing distributions of data (v0.13.2) (2012-2024), Accessed June 2025 at https://seaborn.pydata.org/tutorial/distributions.html
R. Shaw and T. Mitchell-Olds, ANOVA for unbalanced data: An overview, Ecology 74 (1993) 1638 DOI: https://doi.org/10.2307/1939922
Downloads
Published
How to Cite
Issue
Section
License
Copyright (c) 2026 Erin C. McKiernan, Jorge Humberto Arce Rincón, Araceli Torres Pérez, Marco A. Herrera Valdez

This work is licensed under a Creative Commons Attribution-NonCommercial-NoDerivatives 4.0 International License.
Authors retain copyright and grant the Revista Mexicana de Física right of first publication with the work simultaneously licensed under a CC BY-NC-ND 4.0 that allows others to share the work with an acknowledgement of the work's authorship and initial publication in this journal.